Home › GUI
GUI
A small web app that visualizes bollhav lineage — the cross-pipeline model graph stored in the central z_bollhav library, with live state and errors. A FastAPI backend reads it out of Postgres via bollhav's own query functions (bollhav.postgres.registry) and serves JSON; a Svelte Flow frontend draws the graph in the browser — managed models vs unmanaged sources, per-model status lights, upstream contracts (and freshness) on the dependency arrows, plus name search and a tag-expression filter.
It lives in the repo under gui/.
What you see
The detail level is a toggle in the header (the 🎄) — lappland is a bare graph (just boxes, names, arrows); stockholm turns on every decoration.
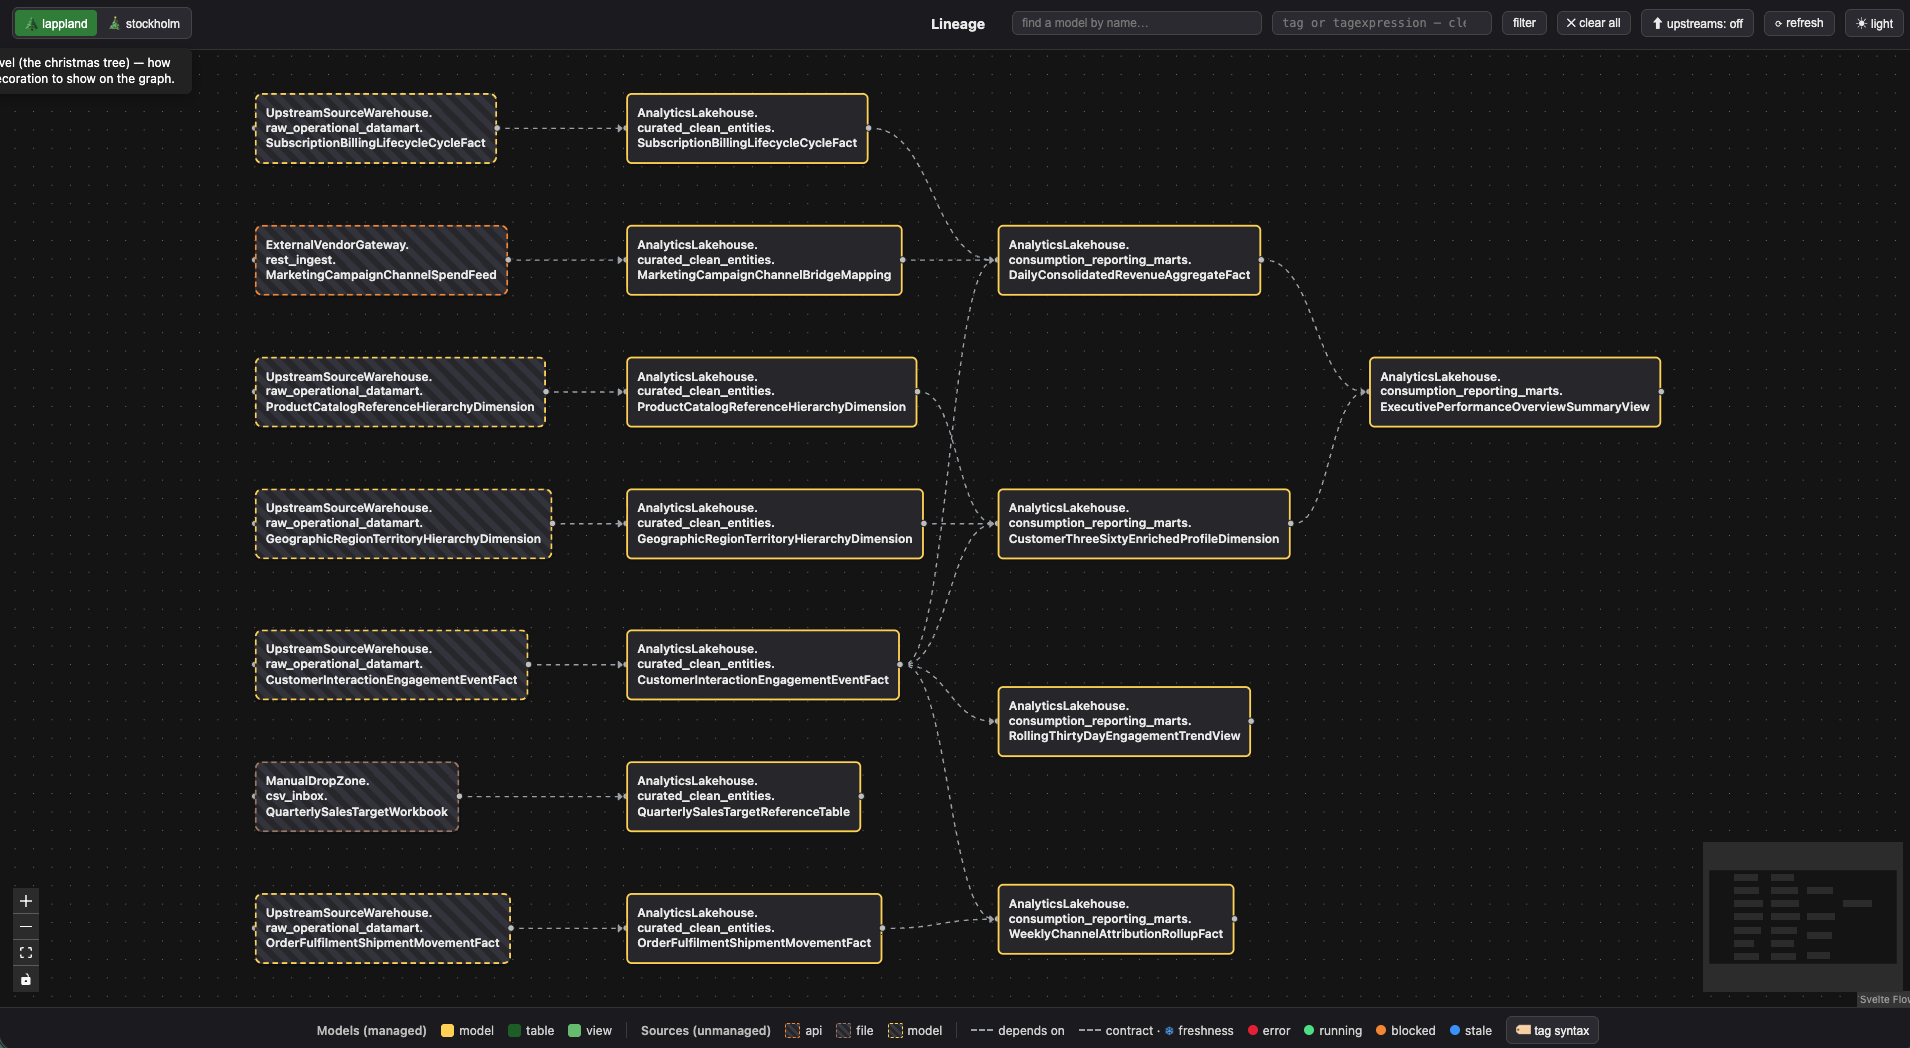
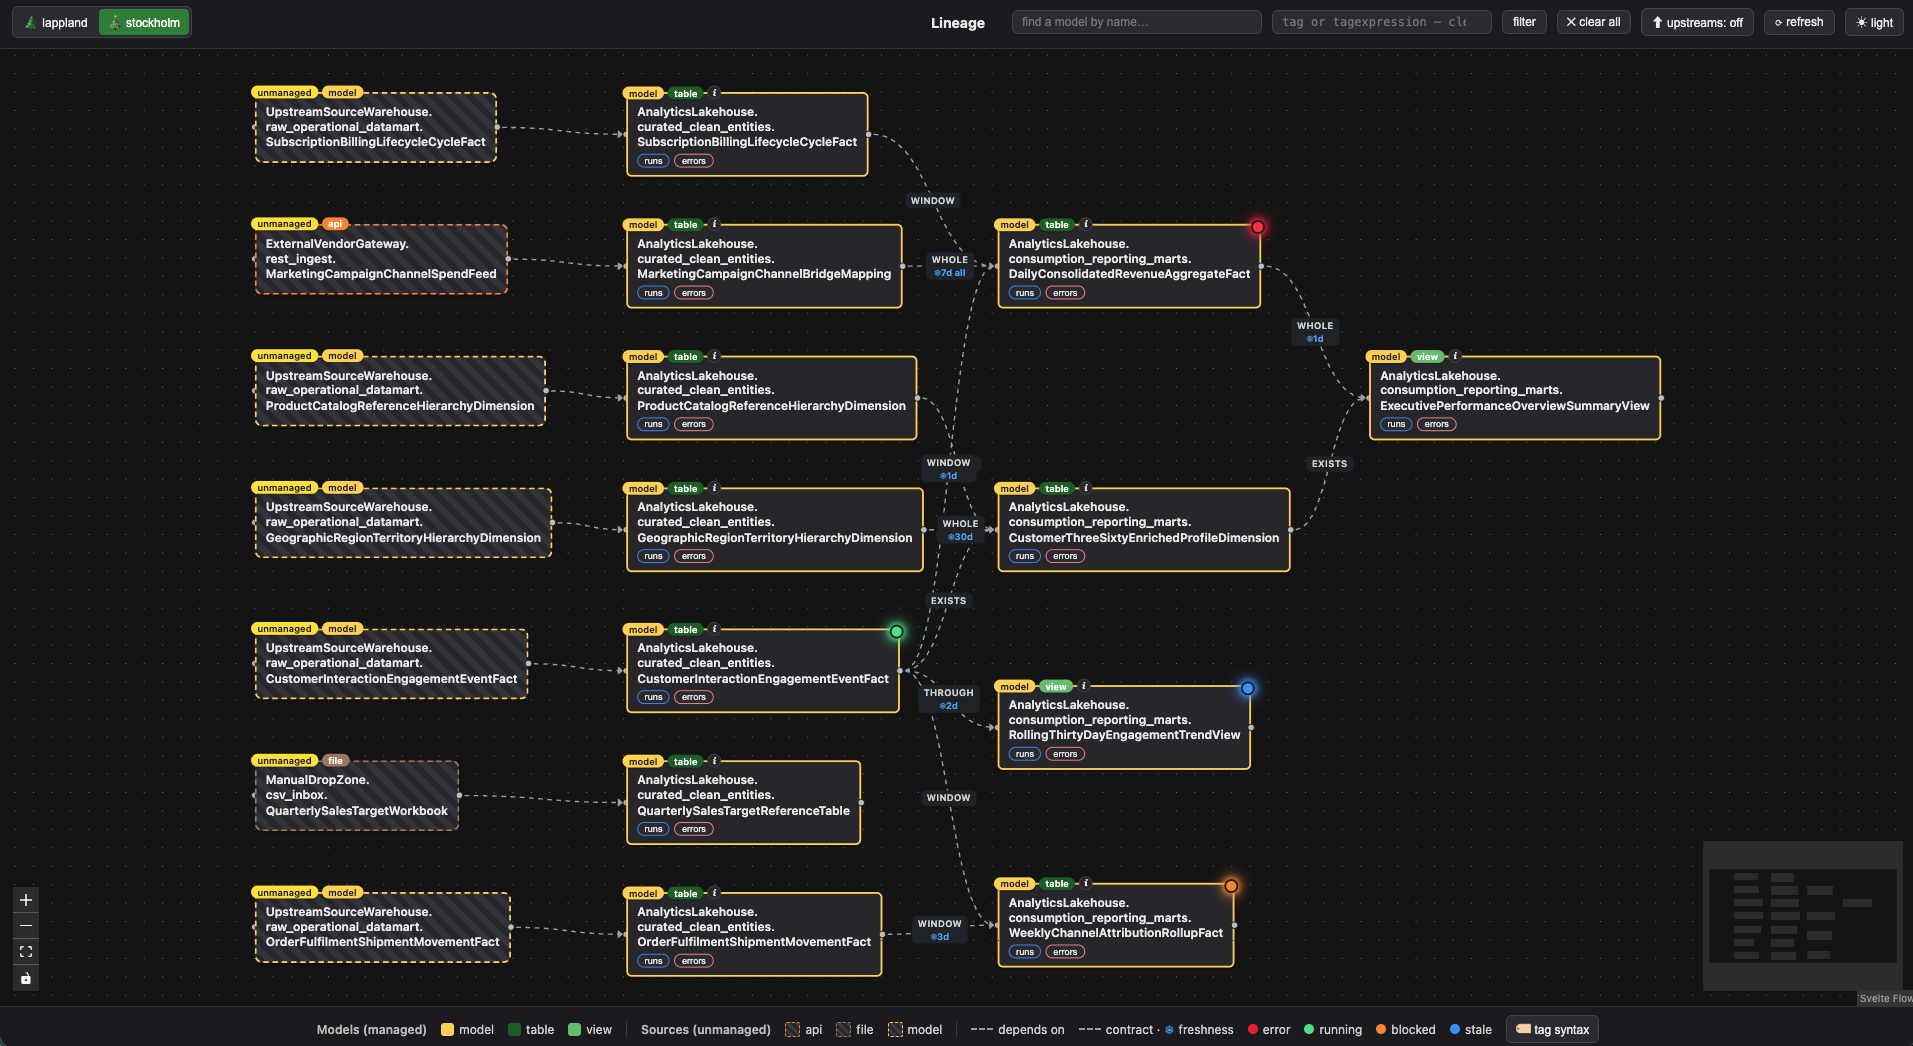
- Managed models have a solid yellow outline with a
modelpill and atable/viewmaterialization pill. Unmanaged sources have a dashed outline coloured by kind (model/api/file/hardcoded) with anunmanagedpill. - Status lights (top-right of a box): error (red), running (green), blocked (orange — an upstream hasn't produced the data yet), and stale (blue — an upstream is present but too old for a freshness contract).
- The dependency arrows are labelled (in stockholm) with the upstream contract: the completeness level (
exists/exact/encapsulate/through/whole) and any ❄ freshness bound. - Search by model name, or filter by tag / tag expression in the second box — e.g.
[clean & fact],[(customer|order) & fact],[consumption & not:view](or a bareclean). Matched models stay — with their upstreams — and the matching part of each name turns green. The 🏷 tag syntax button in the legend explains the expression syntax. (Matching reusesbollhav.model.tagexpr, so it behaves exactly likeTAGS=run selection — but case-insensitively.)
End to end — from pipelines to the browser
How a model travels from the code that defines it, into the library and state tables, out through the API, and onto the screen — and how the TUI drives the same pipelines:
flowchart TD
    TUI["bollhav TUI"] --> PIPE
    PIPE["Pipelines (main.py + @load_models)"] --> MODELS
    MODELS["Models to ModelRuns (matched by TAGS)"] --> LC
    LC["Lifecycle hooks (@model_lifecycle)"] -->|register + state + errors| DB
    DB[("z_bollhav: library + state + errors")] -->|read-only SELECT| API
    API["GUI backend (FastAPI / registry)"] -->|graph JSON| FE
    FE["Svelte Flow frontend"] --> BROWSER["Browser: lineage graph"]
Reading it:
- Pipelines define models. Each pipeline's
main.pyis wrapped by@load_models, which discoversModels (theirTarget,Temporality,State, and upstream contracts), matches them byTAGS, and hands backModelRuns with the run window resolved. - Running them writes the bookkeeping. The lifecycle hooks register each model into the shared
library, seed and flip its state rows (pending → running → applied / blocked) as units of work run, and log any failure to the sharederrorstable — all in the one centralz_bollhavschema. State is also read back at the start of a run to skip already-appliedunits. - The TUI drives the same pipelines. It just runs the nearest
main.pywith the env you pick — so a TUI-triggered run flows through the identical lifecycle into the same library/state. (See TUI.) - The API reads, read-only. The FastAPI backend is a thin adapter over
bollhav.postgres.registry— every endpoint is oneSELECTagainstlibrary/ state /errors. It never writes. - The frontend presents it. Svelte Flow fetches
/graph(and the per-model endpoints on click) and renders the DAG — managed models vs unmanaged sources, status lights, and contract/freshness on the dependency arrows.
The key property: all SQL/schema knowledge lives in bollhav (bollhav.postgres.registry). The backend holds no SQL; the frontend holds no schema knowledge — it just renders what /graph returns.
Get started locally
The fastest way is Docker — two commands, depending on whether you want the demo or your own data. (Full details in the gui/ README.)
See the demo — brings its own Postgres and seeds a realistic raw → clean → consume DAG (with run history and a few errors). Nothing to set up:
Point it at your own state DB — set the connection and disable seeding. SEED=0 is required: without it the demo seed drops and rebuilds the z_bollhav schema and would destroy your real lineage:
The GUI is read-only over your data, and the environment switcher in the header lists every z_bollhav[_suffix] library schema it finds in that database — so prod and any dev / PR envs are all browsable.
| URL | What |
|---|---|
| http://localhost:53173 | the lineage graph UI |
| http://localhost:58137/docs | the API (Swagger) |
| http://localhost:58137/graph | the raw graph JSON |
Useful one-liners
- Stop:
Ctrl-C. Drop the demo DB too:docker compose down -v. - Re-seed the demo:
docker compose exec backend python seed.py - Add a second demo env to toggle between:
docker compose exec backend python seed_dev.py - Ports are deliberately rare (UI
53173, API58137, Postgres55432) so nothing local needs to be free.
Without Docker
Needs a reachable Postgres (BOLLHAV_STATE_DSN, default postgresql://postgres:postgres@localhost:5432/postgres) and Node. gui/ lives inside the bollhav repo, so install the in-repo bollhav (the bollhav==3.0.0rc19 pin in pyproject.toml is for the Docker image and isn't on public PyPI):
# backend — serves lineage JSON on :8137
cd gui/backend
pip install fastapi uvicorn "psycopg[binary]"
pip install -e ../..      # the in-repo bollhav package
python seed.py            # populate the demo DAG (drops z_bollhav first!)
uvicorn app:app --port 8137

# frontend — Svelte Flow UI on :5173, proxies JSON to :8137
cd gui/frontend
npm install
npm run dev
To read a real state DB instead of the demo, skip seed.py and point BOLLHAV_STATE_DSN at your database before starting uvicorn.
Endpoints
Every endpoint is a thin wrapper over bollhav.postgres.registry:
| Endpoint | Registry function | Returns |
|---|---|---|
GET /graph |
get_graph |
the whole DAG — nodes (models + sources) and edges, for the canvas |
GET /match?expr= |
match_tags |
full names matching a tag expression (drives the tag filter) |
GET /models |
list_models |
every registered model |
GET /lineage/{full_name} |
get_lineage |
one model's direct upstream / sources |
GET /tree/{full_name} |
get_upstream_tree |
the recursive upstream tree |
GET /state/{full_name} |
get_recent_state |
recent state rows for a model |
GET /downstreams/{full_name} |
get_downstreams |
who depends on this model |
GET /errors |
get_errors |
recent rows from the shared errors table |
Relation to the TUI
The TUI and the GUI are complementary: the TUI runs pipelines (it triggers main.py with a chosen env and streams the output), while the GUI visualizes what those runs have recorded (lineage, state, errors). Both work against the same central z_bollhav schema — the TUI through a normal pipeline run, the GUI read-only through bollhav.postgres.registry.